CI/CD Pipeline Diagram Overview
A CI/CD pipeline diagram visually represents the automated workflow that transforms code changes into production-ready deployments. In the image, a developer monitors the CI/CD process, including stages like build, test, and production. The diagram features Jenkins integration, containerization with Docker, and cloud deployment indicators. Moreover, CI/CD pipelines accelerate development cycles by automating testing and deployment tasks. Continuous Integration (CI) ensures that code is regularly merged and tested, reducing integration issues. Continuous Deployment (CD) automatically delivers validated changes to production environments. Furthermore, CI/CD enhances collaboration between development and operations teams through transparency and consistency. In addition, monitoring tools provide real-time insights on pipeline performance and stability. Whether using Jenkins, GitHub Actions, or other DevOps tools, this CI/CD pipeline structure helps reduce errors, speed up releases, and improve software quality. Therefore, this visual guide is essential for any modern DevOps or Agile team aiming for efficient and reliable software delivery.
Key Features of CI/CD Pipeline Diagram
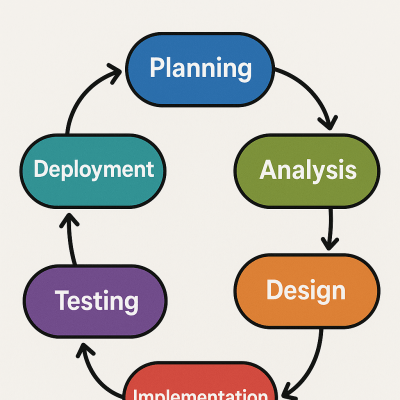
- Build-Test-Deploy Flow: Clearly maps the progression from code commit to production deployment.
- Tool Integration: Displays Jenkins for automation and Docker for container-based deployments in the CI/CD pipeline.
- Monitoring & Feedback: Includes dashboard visuals to track test results, cloud deployments, and performance metrics.
What’s Included with CI/CD Pipeline Diagram
- Illustration of a CI/CD pipeline including Jenkins, Docker, automated build, testing phases, and cloud deployment components.
How to Use CI/CD Pipeline Diagram
- Integrate your source code repo with Jenkins or your chosen CI/CD tool to trigger pipeline runs automatically.
- Configure stages for build, automated testing, and deploy-to-production with rollback options if needed.
Ideal Uses and Placement
- Use this diagram in DevOps onboarding, product documentation, or team planning sessions for CI/CD architecture review.
- Apply it in cloud-native development environments to visualize and optimize automation workflows.
CI/CD Pipeline Diagram Specifications
- High-resolution graphic featuring labeled stages (build, test, production), DevOps tools (Jenkins, Docker), and cloud symbols.
Optimized Imagery & Alt Text

Explore More Resources
- Find similar products: Products Page
- Gain further insights: Our Blog
- Enhance your understanding: AI & QA Resources
- Learn from experts: Red Hat: What is CI/CD?
Why Choose CI/CD Pipeline Diagram?
This CI/CD diagram simplifies automation flow and highlights key DevOps tools. It improves communication, onboarding, and deployment visibility. Moreover, it supports Agile delivery and ensures faster, more reliable software releases.
Order Your CI/CD Pipeline Diagram Today!
Streamline your DevOps workflow with this visual CI/CD pipeline guide—perfect for engineering teams and DevOps leaders!